
We're in phase three of our machine-learning project now—that is, we've gotten past denial and anger, and we're now sliding into bargaining and depression. I've been tasked with using Ars Technica's trove of data from five years of headline tests, which pair two ideas against each other in an "A/B" test to let readers determine which one to use for an article. The goal is to try to build a machine-learning algorithm that can predict the success of any given headline. And as of my last check-in, it was… not going according to plan.
I had also spent a few dollars on Amazon Web Services compute time to discover this. Experimentation can be a little pricey. (Hint: If you're on a budget, don't use the "AutoPilot" mode.)
We'd tried a few approaches to parsing our collection of 11,000 headlines from 5,500 headline tests—half winners, half losers. First, we had taken the whole corpus in comma-separated value form and tried a "Hail Mary" (or, as I see it in retrospect, a "Leeroy Jenkins") with the Autopilot tool in AWS' SageMaker Studio. This came back with an accuracy result in validation of 53 percent. This turns out to be not that bad, in retrospect, because when I used a model specifically built for natural-language processing—AWS' BlazingText—the result was 49 percent accuracy, or even worse than a coin-toss. (If much of this sounds like nonsense, by the way, I recommend revisiting Part 2, where I go over these tools in much more detail.)
It was both a bit comforting and also a bit disheartening that AWS technical evangelist Julien Simon was having similar lack of luck with our data. Trying an alternate model with our data set in binary classification mode only eked out about a 53 to 54 percent accuracy rate. So now it was time to figure out what was going on and whether we could fix it with a few tweaks of the learning model. Otherwise, it might be time to take an entirely different approach.
An entirely, but not entirely, entirely, different approach
My first thought was perhaps I was trying to classify headlines in the wrong way, and instead I should apply label values based on what their click rate was—that is, the number of clicks the headlines received divided by the number of times they were displayed to Ars readers. Using the click rate, I performed some basic statistical analysis to apply a rating of 0 to 4 to each headline. From there, I attempted a multi-category classification of the data based on the new rating labels.
To increase the size of the training set, I went back to Ars and got even more headlines—including ones where the click rates on both headlines were so close that the A/B test could not choose a winner with any confidence. With this new, larger set of data (nearly double the size at 10,696 headline pairs), I tried again. First, I opted for the Autopilot feature again. This went poorly. My best result achieved an accuracy rate of 43 percent.
Undeterred, I tried the same approach with BlazingText in a manually executed training run:
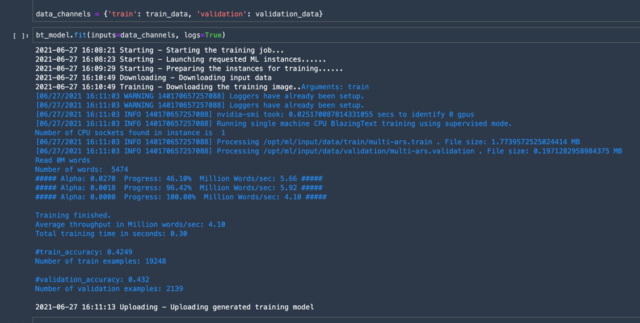
Well, at least this was showing a level of consistency in failure.
That suit looks a little big on you
The typical reason for accuracy this bad is "underfitting"—where the model is unable to find the relationship between the input data (our headline) and the output (the "winner" or "loser" label affixed). This often happens when the training data set is too small, or when there are not enough "input features"—the raw data itself being the primary input feature. Without enough features, the basis for the algorithm doesn't match whatever patterns may be in the data closely enough, so it ends up with a high level of inaccuracy.
The opposite of underfitting is overfitting, where the model is tuned to be too representative of the training data. This level of training ends up making the model less accurate when presented with data outside the training set. If I had run the training data through the model more times, I might have seen the training accuracy increase, but the verification accuracy (using the data withheld to test the model) starts to decrease.
Both underfit and overfit can happen with too little data. So data scientists often have to create additional representations of the raw data in order to provide additional input features to make the relationship between input and output more apparent—what's referred to as "feature engineering."
So-called "deep-learning" systems automate feature engineering based upon algorithms built into the model. But if you craft too many input features to push toward a desired answer, you can get "inceptionism"—discovering patterns where there weren't any in the first place, as Google research published in 2015 showed.

In addition to feature engineering, there is another set of things we could manipulate to tweak the training: hyperparameters. These are the software dials, levers, and knobs on the machine-learning model that affect how it processes the data. AutoPilot configures these automatically in its tuning process, trying 250 different combinations for its underlying model. For the approach we were taking with BlazingText, however, I had thus far left the hyperparameters untouched.
But given how much I needed to move the needle, I didn’t think tweaking the same model was going to get me very far. I needed some expert advice. In response to my plea for help, Amazon put me in contact with one of its SageMaker experts, and the real fun started.
An entirely different approach for real this time
The AWS expert realized that what we needed for this to work was both a different model from the one I had been using and a different approach—one that could essentially double the amount of information that we had for each headline. That approach was to use both headlines at the same time—with the losing headline providing context for the winner and vice versa.
The fellow explained that one of the problems with trying to determine whether a headline is a "winner" or a "loser," especially with something like BlazingText, is ensuring the program has enough context to make the call. The idea with our actually-for-real different approach is to provide that context, by providing both headlines.
To do the training based on this approach, we used Hugging Face, a multi-purpose natural-language processing platform. Hugging Face gains relevance here because it features a big variety of different models, some of which are themselves trained on news data already.
Our expert demonstrated how this sort of preprocessing of text can be used by a model by showing me some sample code that uses this sort of tokenization to give a probability of one sentence being a paraphrase of another sentence, using a model based on a version of BERT (Bidirectional Encoder Representations from Transformers):
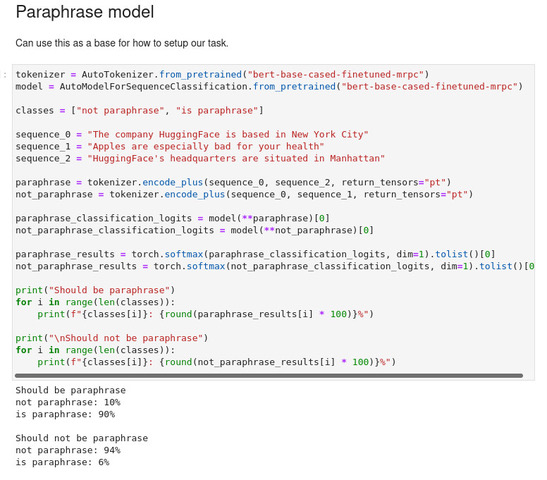
In the image above, the sentences being compared in each case were tokenized together and then checked against the model to determine a probability of them being paraphrased versions of each other. Based on the pre-training, the model recognizes "Manhattan" as being similar in meaning to "New York City," and it identifies the entity (Hugging Face) in both the first and second sentences. This model also spots neither of those commonalities in the third unrelated sentence.
For our first expert-guided swing at the Ars data, we chose SqueezeBert. SqueezeBert is a relatively lightweight model—around 300 megabytes in size. Some of the more heavy-duty text processing models (such as OpenAI's GPT-2 model, which I messed around with to test its ability to create "deep fake" news articles) can be much larger. GPT-2, for example, is 1.5 gigabytes. You'd use GPT-2 for heavy-duty natural-language processing, but SqueezeBert can do the job well enough and already comes with that vital news context baked into it.
We used the same data set I had tried on my last attempt—the full Ars A/B test corpus—but this time filtered out instances that had insignificant differences in clicks between the winner and the loser. To prepare the data, the winning and losing headlines were then tokenized together. Tokenization for SqueezeBert, BERT, and other similar models is not the same as the natural-language processing tokenization we've discussed previously. Instead of just breaking apart the words and treating them as tokens, the tokenizer for SqueezeBert converts the text of our headlines into tensors—arrays of numbers that represent the entire headline as vectors. When the SqueezeBert tokenizer processes this headline pair:
- Porsche will build a high-performance battery factory in Germany
- Porsche is building a battery factory for motorsport and performance EVs
…the resulting tokens bear no resemblance to human-readable content:
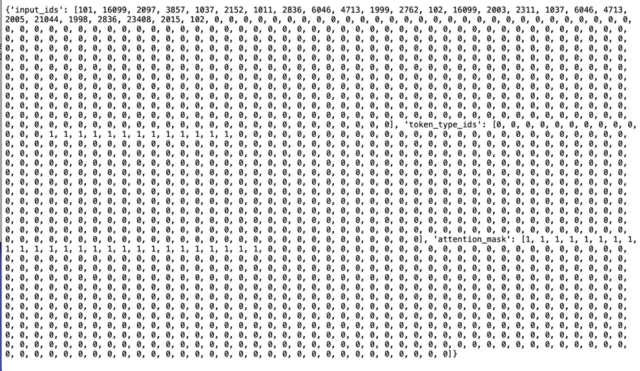
This process generates a series of input IDs, and then tokens are mapped to the model's vocabulary. For consistency across the set, these arrays are padded with zeros so they can handle inputs of different lengths. The token type IDs differentiate between the winning and losing headlines—the first stretches of zeros in the token type IDs represent the first headline of the text pair. The second headline is indicated by the series of ones. The segment labeled "attention mask" differentiates what's actually a word versus what's padding—telling the model what can be ignored in the array during processing.
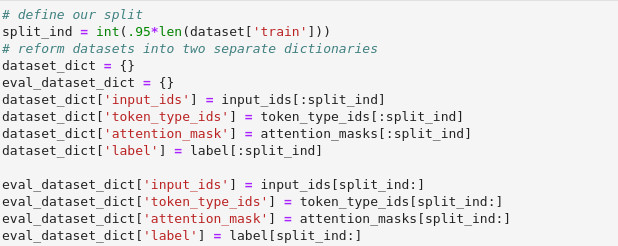
As with our previous efforts, the tokenized headlines were broken into two separate sets—the training set and the verification set. Our Jupyter notebook code extracted the columns needed for the training run:
Once those sets were formatted for use by PyTorch (as seen in the second code block above), our expert ran the training job locally. I repeated the process on my own machine, though in retrospect I should have probably run it up on SageMaker. Given my lack of GPUs available to do the heavy lifting on my Xeon box running Ubuntu, it took about five hours.
And the winner is…
We ended up running the jobs two ways: one with all of the headline data, and one just using data where there was a significant gap in click rate between the winners and the losers (over 1 percent). The results were… a relief, to be honest.
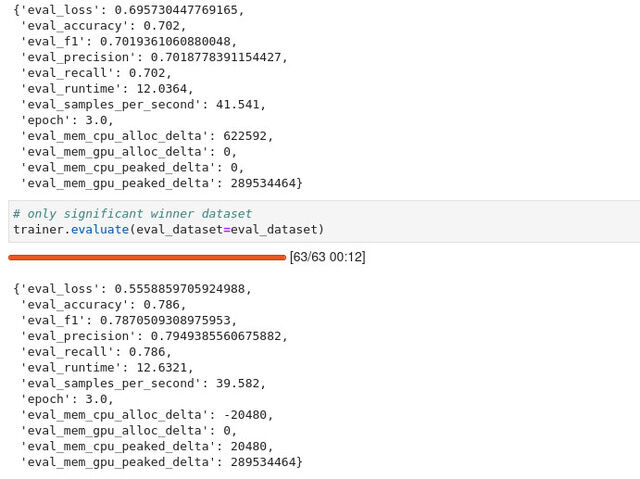
The set with all of the headlines achieved a 70 percent accuracy rating. That rating held up for some important test values as well: precision (which is a ratio of true positive categorizations to all positive scores—both true and false) and recall (a ratio of correct positives to the sum of everything that should have been positive). The F1 score, which is based on both precision and accuracy, also came in at 0.7. Not bad!
Things got even better when the data was filtered to use only headline pairs where the differential in click rate was over 1 percent. There, the accuracy was almost 79%. Things worked much better with the filtering, clearly.
With that kind of accuracy, our expert suggested, we could probably do pair comparisons and use the confidence values that come out of the model as a way of scoring headlines against each other. If it's not confident enough, we could go with a neutral result—if it's very confident, we could declare a definitive winner.
Given those sorts of results, we're going to work on doing an implementation of that model for a trial run of our headline-picker AI. We're also looking at doing a run with the bigger GPT-2 model—which, based on our results in this effort, may be even more accurate.
As we enter the home stretch, we'll try to do this all in SageMaker so I can set up an endpoint that we can hit with a web application—perhaps using the bigger, fancier model, if my AWS account can take it. Who knows? Maybe next, we'll take comment moderation. (No, no we won't. | Don't tempt me! -Ed)
Part four should be running on Thursday, and we'll cap this experiment off next week with a livechat where you can throw questions at me and also at Ars Senior Technology Editor Lee Hutchinson about what went right, what went wrong, and how we can do things better next time.
Our AI headline experiment continues: Did we break the machine? - Ars Technica
Read More

No comments:
Post a Comment