
This is the second episode in our exploration of "no-code" machine learning. In our first article, we laid out our problem set and discussed the data we would use to test whether a highly automated ML tool designed for business analysts could return cost-effective results near the quality of more code-intensive methods involving a bit more human-driven data science.
If you haven't read that article, you should go back and at least skim it. If you're all set, let's review what we'd do with our heart attack data under "normal" (that is, more code-intensive) machine learning conditions and then throw that all away and hit the "easy" button.
As we discussed previously, we're working with a set of cardiac health data derived from a study at the Cleveland Clinic Institute and the Hungarian Institute of Cardiology in Budapest (as well as other places whose data we've discarded for quality reasons). All that data is available in a repository we've created on GitHub, but its original form is part of a repository of data maintained for machine learning projects by the University of California-Irvine. We're using two versions of the data set: a smaller, more complete one consisting of 303 patient records from the Cleveland Clinic and a larger (597 patient) database that incorporates the Hungarian Institute data but is missing two of the types of data from the smaller set.The two fields missing from the Hungarian data seem potentially consequential, but the Cleveland Clinic data itself may be too small a set for some ML applications, so we'll try both to cover our bases.
The plan
With multiple data sets in hand for training and testing, it was time to start grinding. If we were doing this the way data scientists usually do (and the way we tried last year), we would be doing the following:
- Divide the data into a training set and a testing set
- Use the training data with an existing algorithm type to create the model
- Validate the model with the testing set to check its accuracy
We could do that all by coding it in a Jupyter notebook and tweaking the model until we achieved acceptable accuracy (as we did last year, in a perpetual cycle). But instead, we'll first try two different approaches:
- A "no-code" approach using AWS's Sagemaker Canvas: Canvas takes the data as a whole, automatically splits it into training and testing, and generates a predictive algorithm
- Another "no-/low-code" approach using Sagemaker Studio Jumpstart and AutoML: AutoML is a big chunk of what sits behind Canvas; it evaluates the data and tries a number of different algorithm types to determine what's best
After that's done, we'll take a swing using one of the many battle-tested ML approaches that data scientists have already tried with this data set, some of which have claimed more than 90 percent accuracy.
The end product of these approaches should be an algorithm we can use to run a predictive query based on the data points. But the real output will be a look at the trade-offs of each approach in terms of time to completion, accuracy, and cost of compute time. (In our last test, AutoML itself practically blew through our entire AWS compute credit budget.)
It’s Leeroy Jenkins time
There is no test of the quality of a business-targeted tool like just jumping in and using it without reading the documentation. So that's what we did with SageMaker Canvas.
Canvas is, in essence, a business-analyst-friendly front end put atop AWS's AutoML technology. Unlike SageMaker Studio itself, Canvas is intended for line-of-business types to take in batches of corporate data and generate various types of models, including the binary predictive type we're aiming for with this data. All you need to do is bring the data; Canvas does the shuffling, splitting, and statistical crunching based on the type of problem, picking the best model to be used for the job at hand.
Bringing up the Sagemaker dashboard from AWS, we hit the "get started" button and prepared to do data combat.
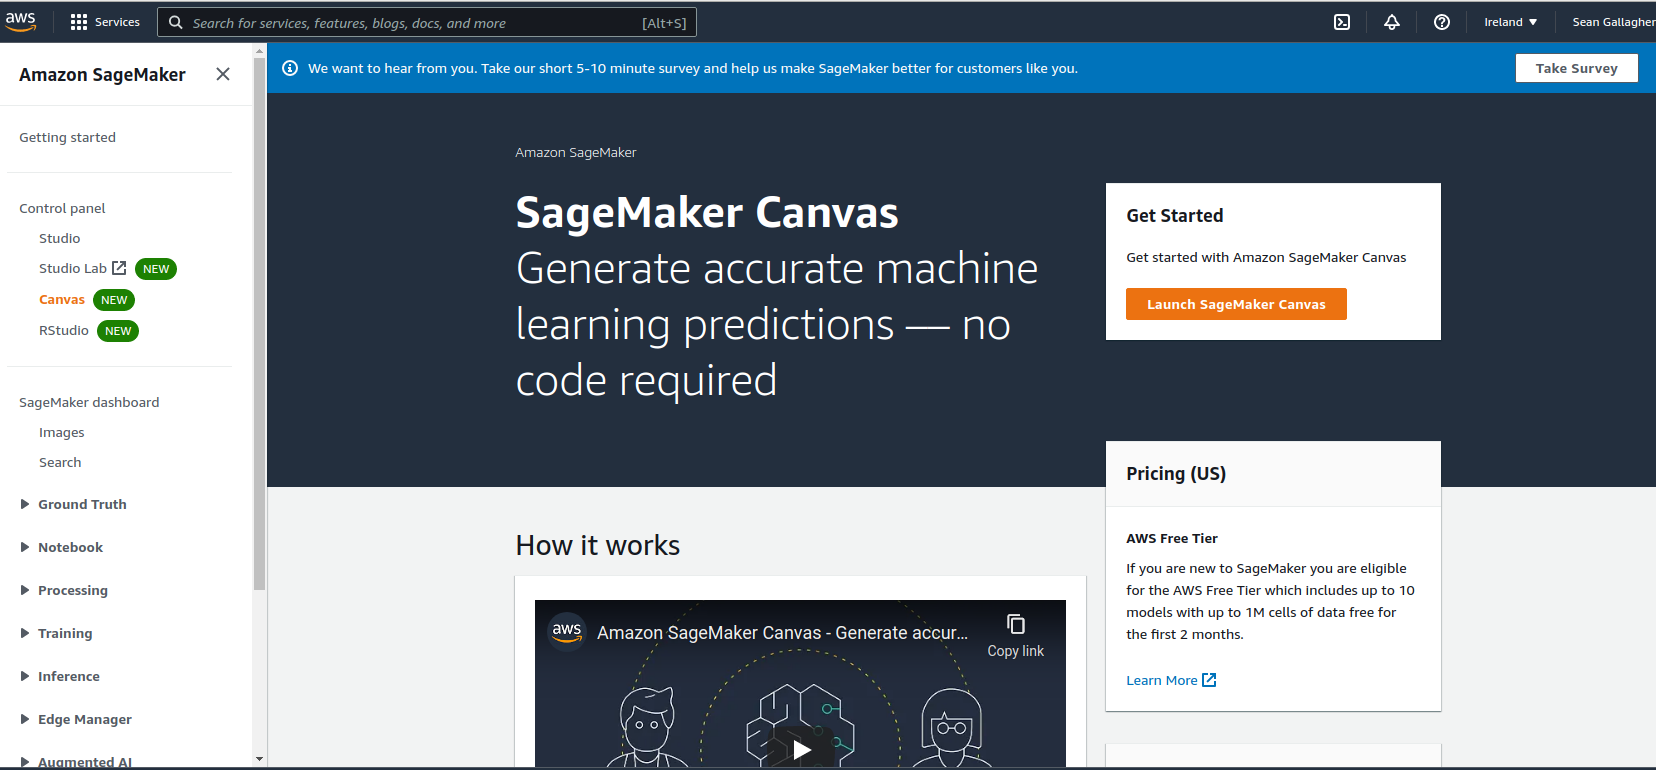
Launching Canvas kicked off the auto-creation of all the required underlying AWS resources to run the tool. Once it was complete, the Canvas interface opened and presented the option of going through a brief tutorial with some preloaded data sets.
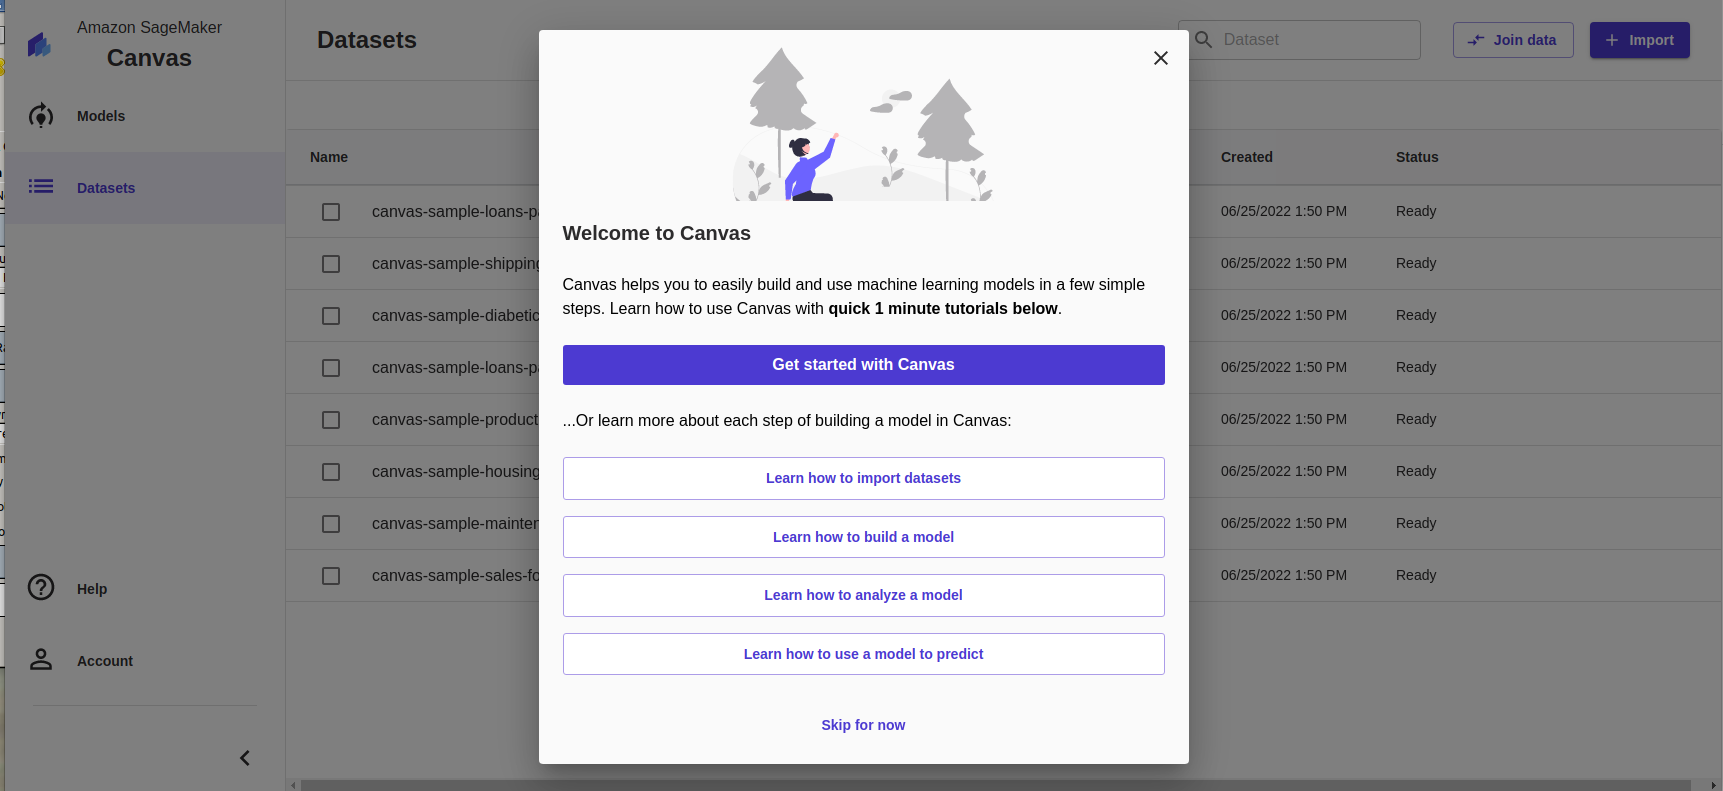
But who needs a tutorial, right? We hit the "go" button.
Unfortunately, we immediately hit a brick wall. While configuring the project for Canvas automatically configured an S3 storage bucket for the project, Canvas is designed for enterprises, and users need to have policies configured for them by the root administrator to upload their own data files.
Since we are the root administrator and we had to go to the S3 service dashboard to do this, we figured we would just do the uploading from there because that works just as well and is much less of a hassle than setting up AWS access policies. However, if we were in an actual enterprise, we could have given Canvas users access to upload their own data and pulled it from other AWS resources, such as the RedShift database platform.
We uploaded the smaller Cleveland Clinic data set and then jumped back into Canvas to import the file we needed. Once we had selected the CSV, the next step presented by Canvas was "Build." However, Canvas' interface informed me that my data set was too small to run the full Canvas magic. While Canvas can produce models built with data sets under 500 rows, it will only run a "quick build"—the resulting model cannot be shared with others through Sagemaker Studio.
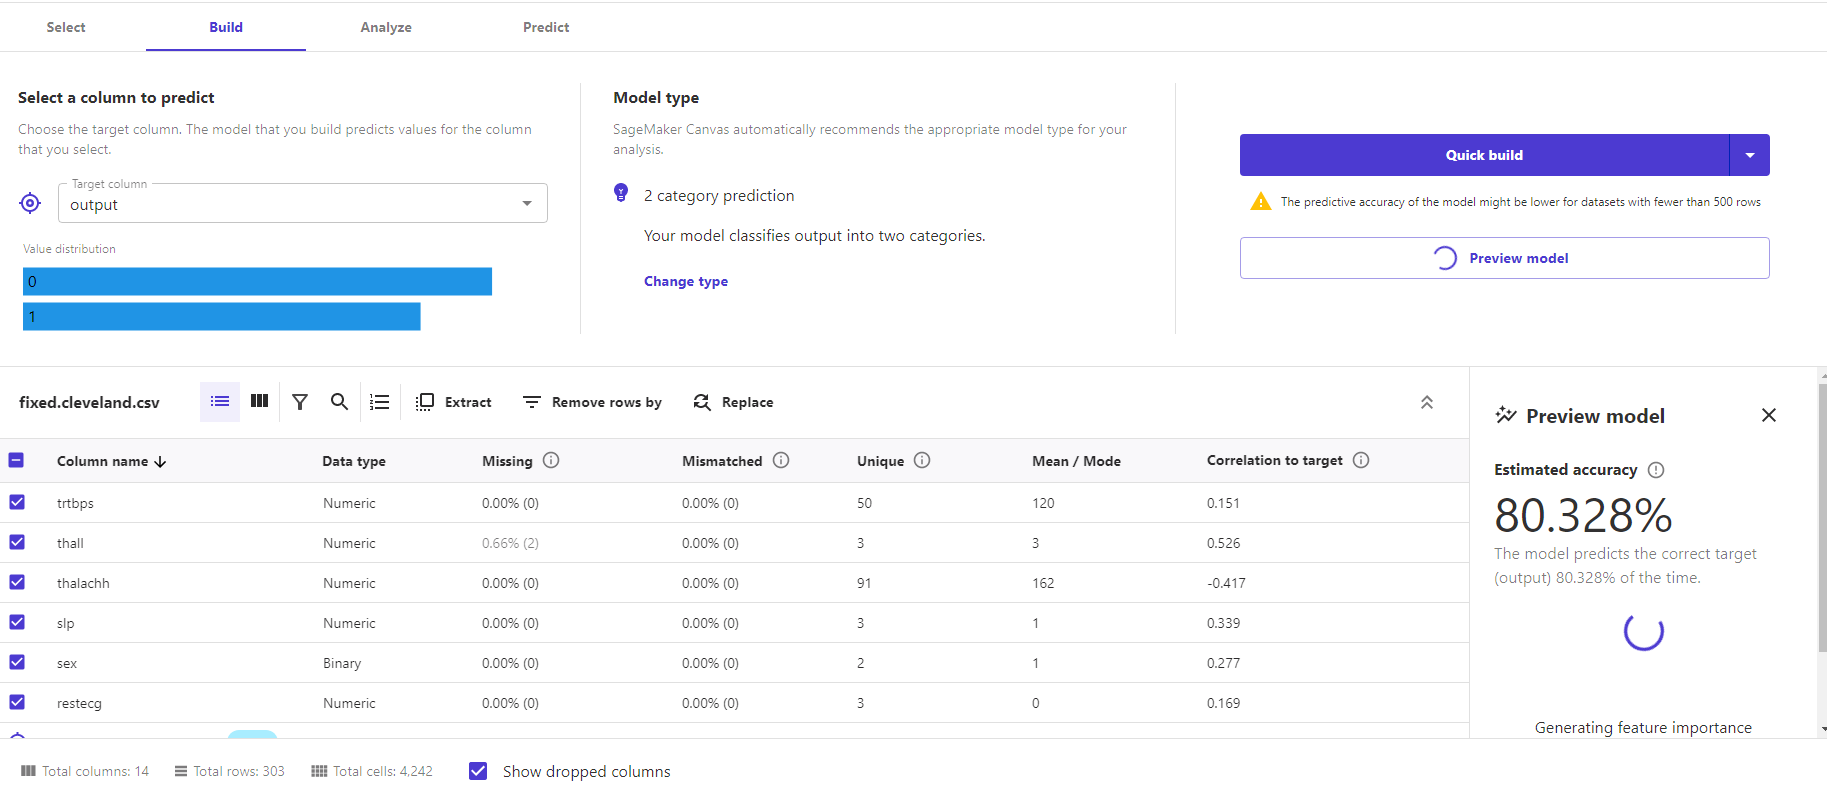
Before we hit "Quick Build," however, we were offered an opportunity to get a quick estimate of what the accuracy of this small-data-set model would be. We selected the column we wanted predictions for ("output") and clicked "Preview" for a forecast.
"Preview Model is a really quick first pass at directional insights," explained Amazon Web Services Senior Product Manager Danny Smith when we ran our progress by him later. "It's not going to work great for all data sets, but for most, if you press that button, you get really quick accuracy and feature importance, which can help you decide if it’s worth it to spend money on training....What we see is, customers press Preview Model a lot as they first start exploring. They press Quick Build less as they fine tune their dataset, and then—when they want the best the autoML can offer, or if they want to share it with a data scientist—they press Standard Build. It's kind of like 'let's roll downhill'—let's do a lot of preview, let's do a few quick, and then let's do one standard, and then they share the standard."
Almost immediately, we got an estimate of how accurate the resulting model would be. The preview also provided an upfront analysis of the importance of each column of data to the prediction made by the algorithm. For a small data set and a quick-and-dirty modeling run, a predicted accuracy of 80 percent seemed ambitious. But we clicked "quick build" and prepared to wait for the model to be trained and tested. We didn't have to wait long.
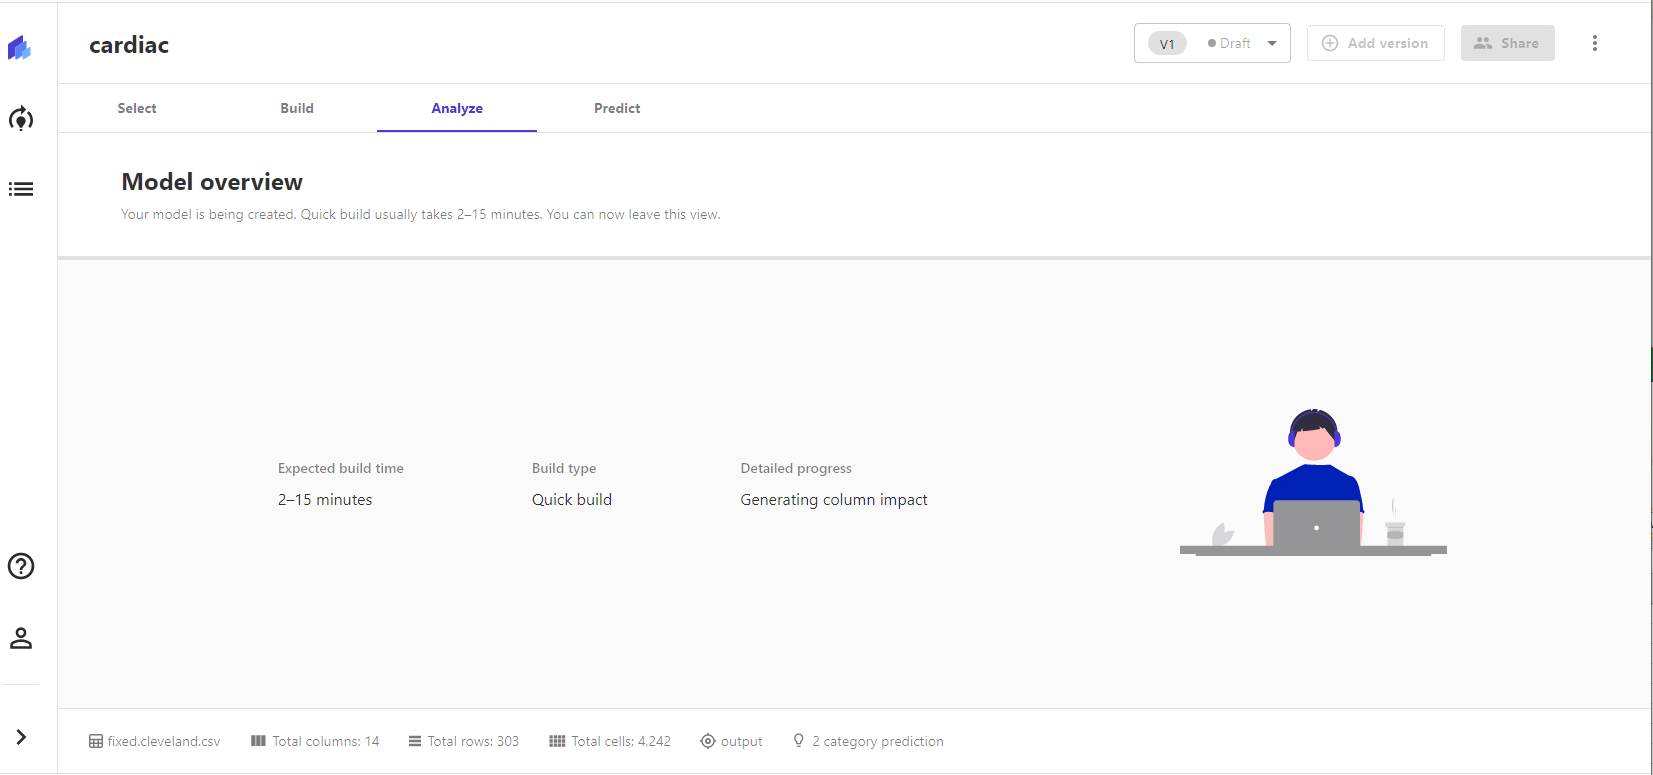
The quick build was indeed quick, and the results from the testing set were right on the forecast. But the accuracy rating was based on a test set of only 61 records pulled from the small data set—so it might be a bit ambitious.
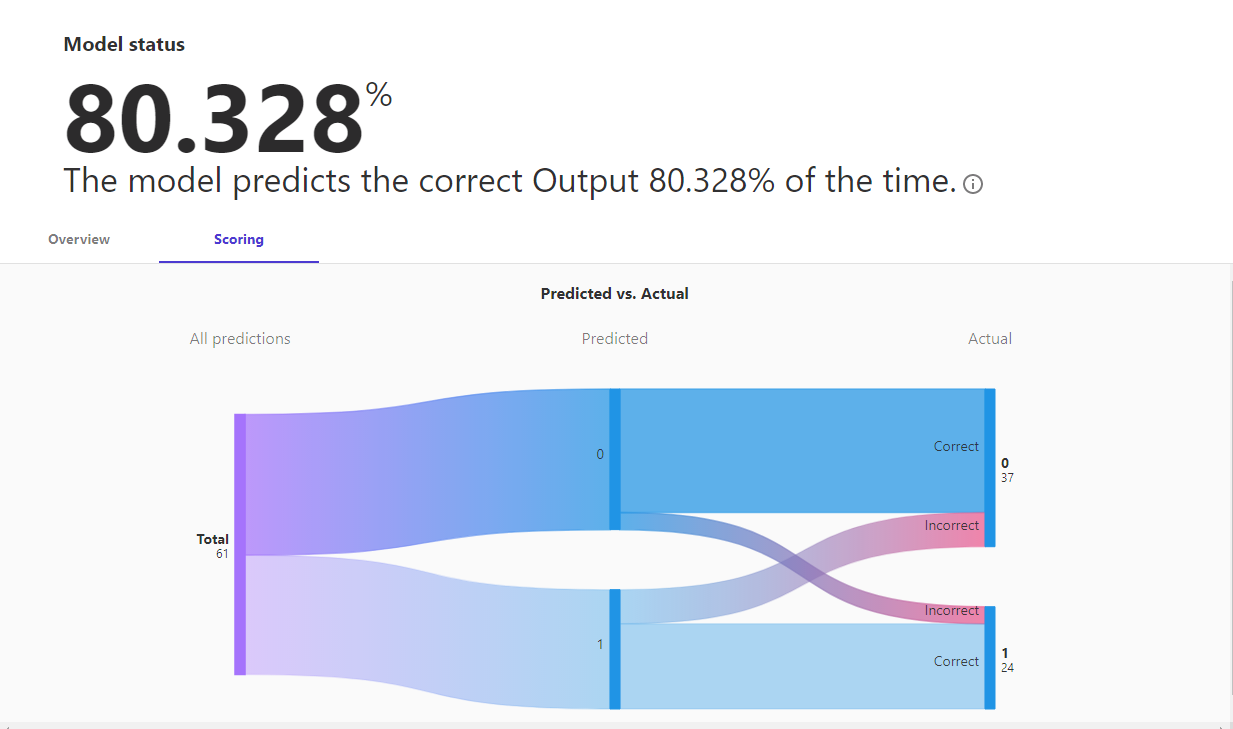
Further analysis also showed the inaccuracies—mostly with false positives for cardiac illness. The good news was that when the algorithm predicted for patients who were found to have cardiac disease, the prediction was accurate nearly 85 percent of the time, though the overall accuracy was somewhat lower.
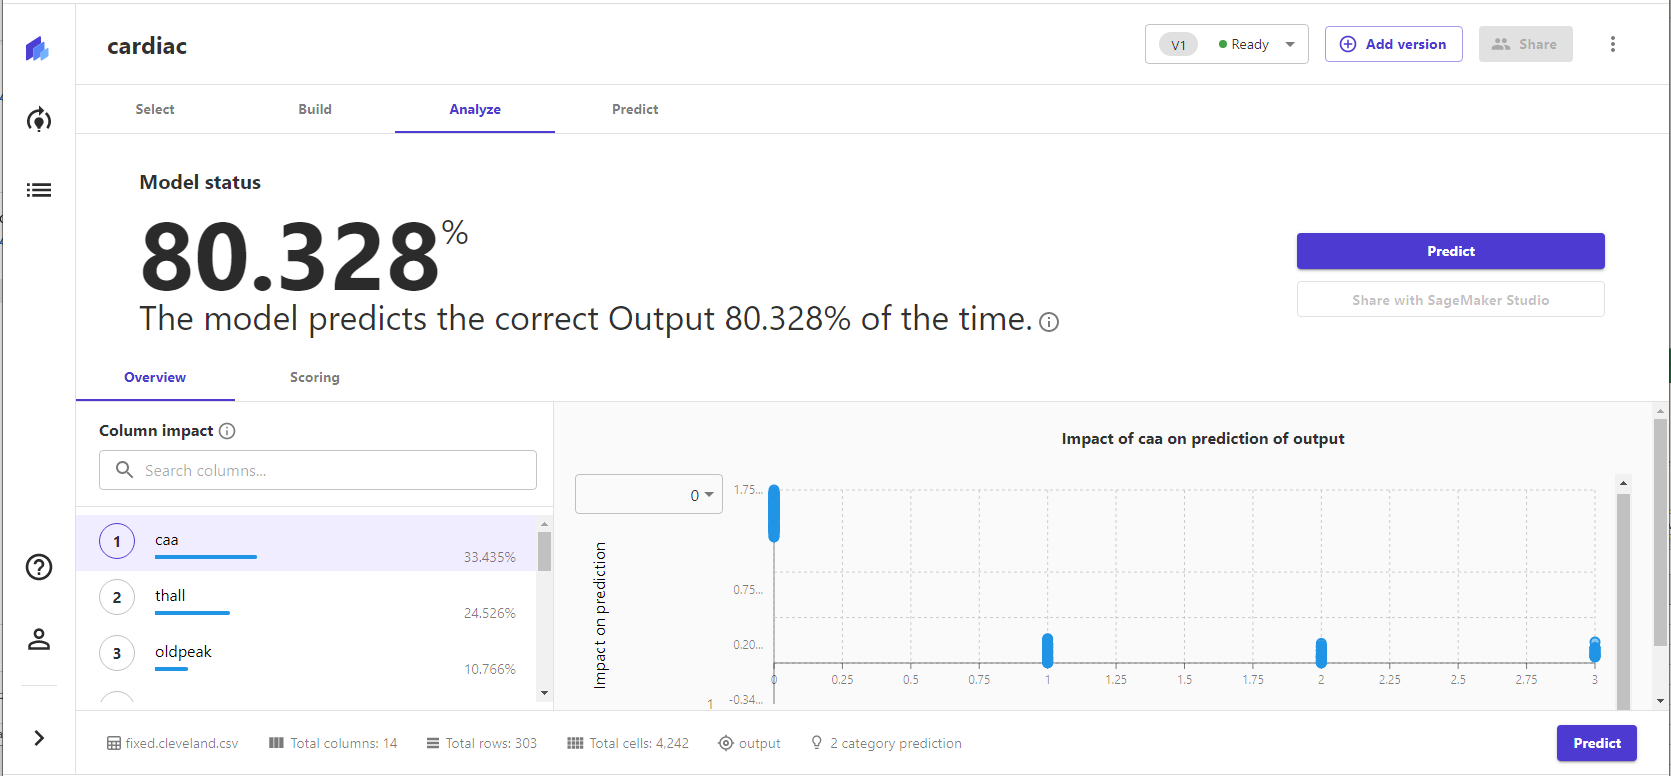
The finished model came with an output of "column impact"—a final analysis of the importance of each data point in forecasting.
The ranking of these inputs hews pretty closely to the Pearson Correlation Coefficient scores we generated from the data set in our pre-test data analysis. The angiogram results ("caa"), thalassemia ("thall"), and ST depression ("oldpeak") had the highest correlation coefficients, though the correlation coefficients of exercise-induced angina ("exng") were much higher than their relative importance to the model here:
| Column | Pearson Correlation | Model rank of importance |
| thall | 0.512574 | 2 |
| caa | 0.461603 | 1 |
| exng | 0.431894 | 12 |
| oldpeak | 0.42451 | 3 |
| thalachh | -0.417167 | 7 |
| cp | 0.414446 | 4 |
| slp | 0.339213 | 5 |
| sex | 0.276816 | 13 |
| age | 0.22312 | 6 |
| restecg | 0.169202 | 10 |
| trtbps | 0.150825 | 9 |
| chol | 0.085164 | 8 |
| fbs | 0.025264 | 11 |
To see how the claimed 80 percent accuracy held up, we ran a batch prediction job with it using the Hungarian Institute data. We ran the whole set and then grabbed the results for the additional rows:
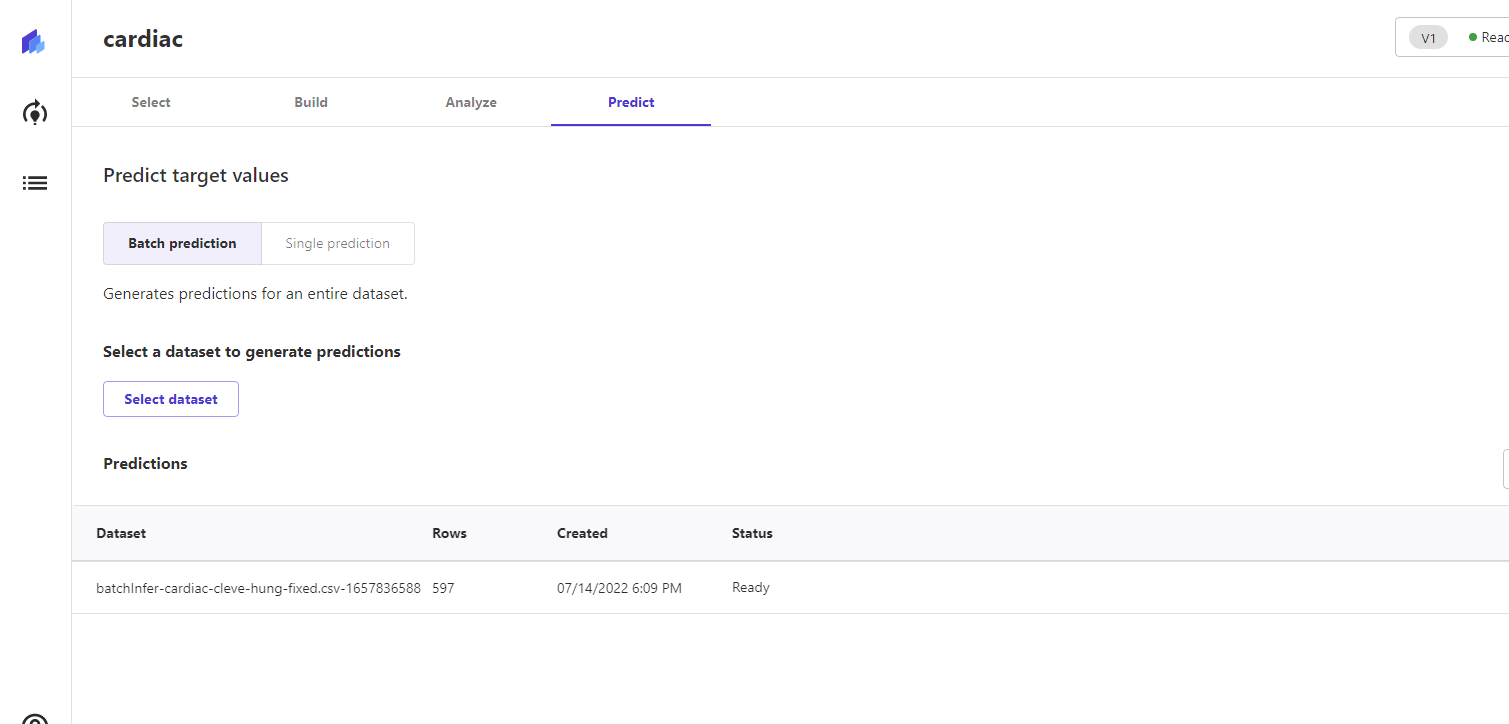
The Hungarian data has some holes that make it not a great fit for the model built from the Cleveland Clinic data. First, out of the 295 records, only 27 had the second-most important column ("thal"). And only two had the most important column ("caa").
Still, it was worth a shot, so we ran the set. Despite the gaps, the model had a 78 percent accuracy rate overall in predicting the outcome. In the two cases where "caa" was present, both were correctly guessed. When "thall" was present but "caa" wasn't, it predicted accurately 73 percent of the time.
These predictions were not just binary guesses. The probability associated with each was also provided; most of the inaccuracies were in situations where the probability of correctness was in the 50 to 60 percent range.
These results were light-years better than what we got in our last machine learning attempt, where our models' accuracy was hardly ever much better than a coin toss. Given how little data was available for a substantial test set, we were beginning to doubt the claims of 90 percent accuracy from some of the people who had previously worked with the smaller data set—at least beyond the test data.
Go big or go home
Clearly, the amount of data was the limiting factor here. So we returned to the source material and added rows from the Budapest data, bringing the total rows to just under 600. To get more data to work with for later testing, we formatted the Swiss data set for running additional predictions—even though that data was missing almost 50 percent of the inputs available from the two largest sets.
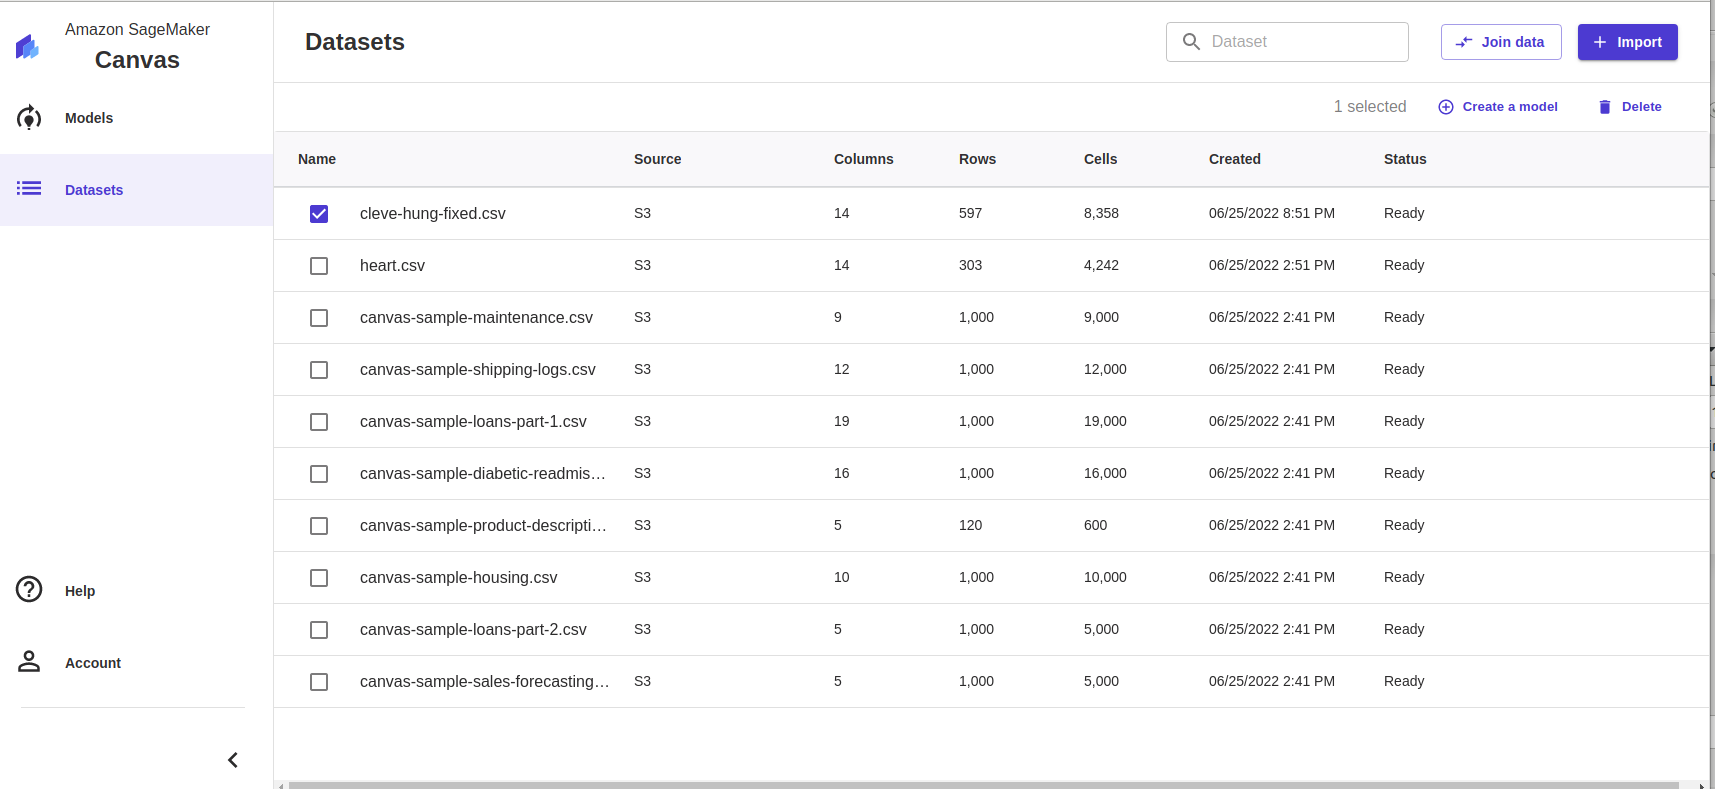 Going big with more data.
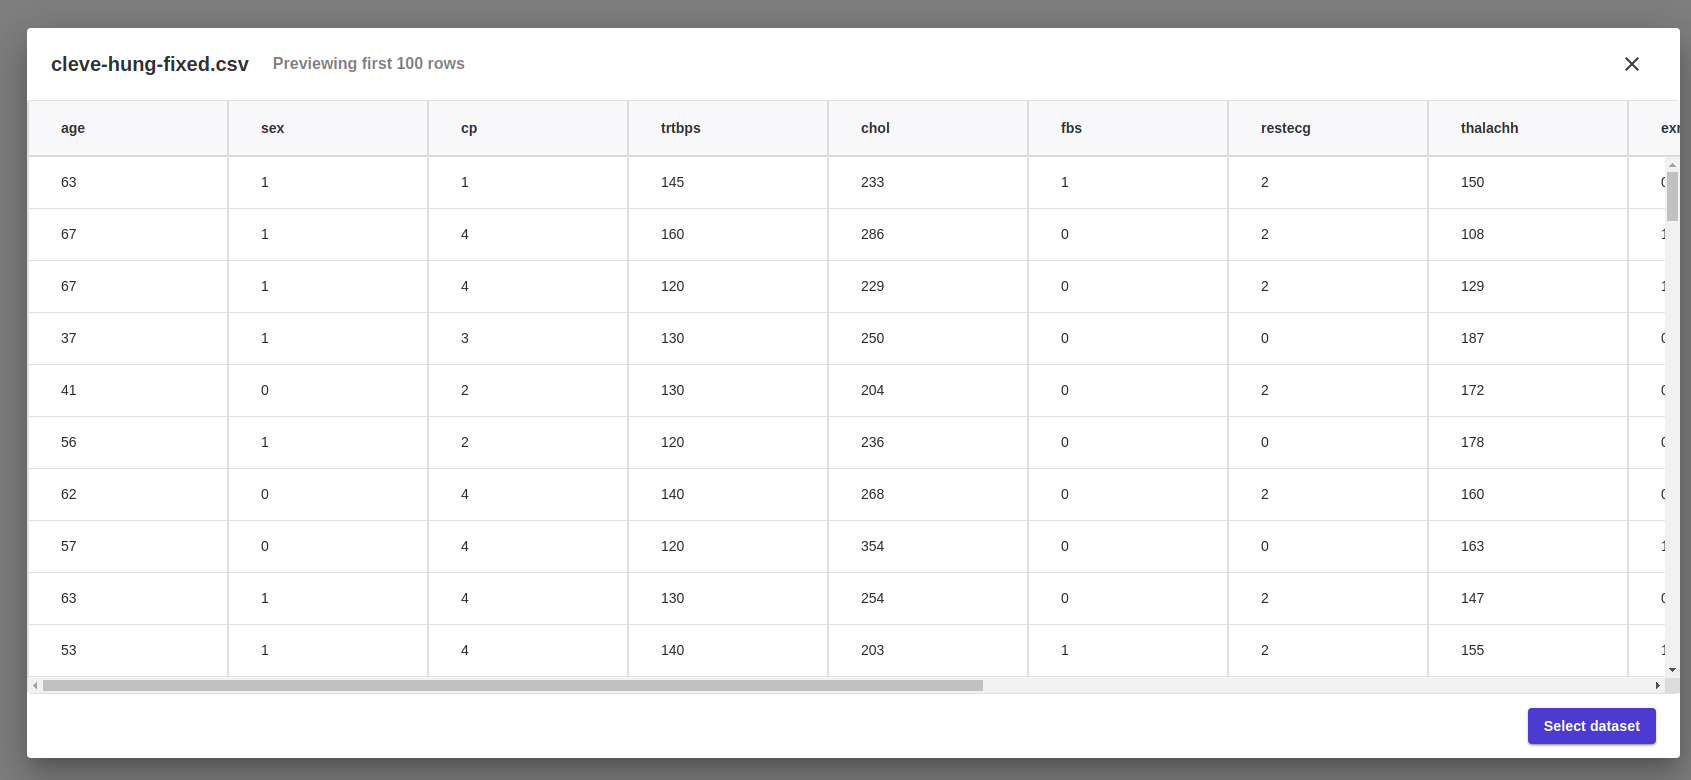 A peek into our data set.
We selected the new data set, hit "Create a model," and returned to the previous workflow.
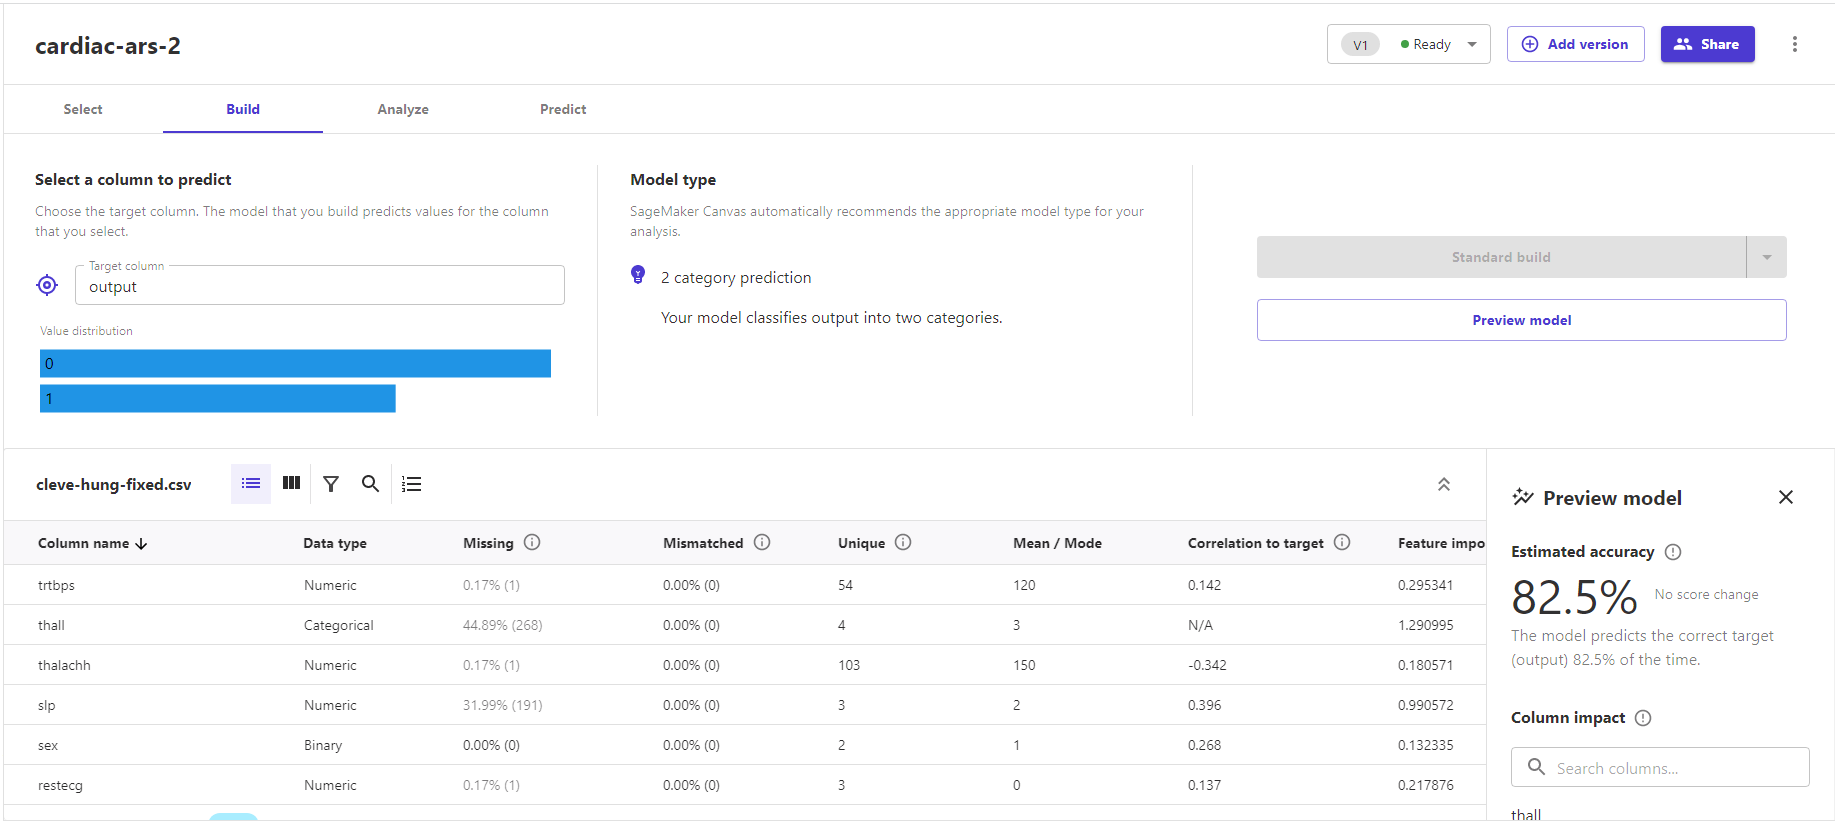
This time, we had enough data to do a "standard build" with Canvas. The build preview estimated the accuracy of a full model at 82.5 percent—slightly higher than the previous estimate, but at least we knew we would have more testing data this time.
With more rows to hoe, we went for the standard build—which we were then warned would take about two hours. We began to wince slightly at what this would cost us in GPU time.
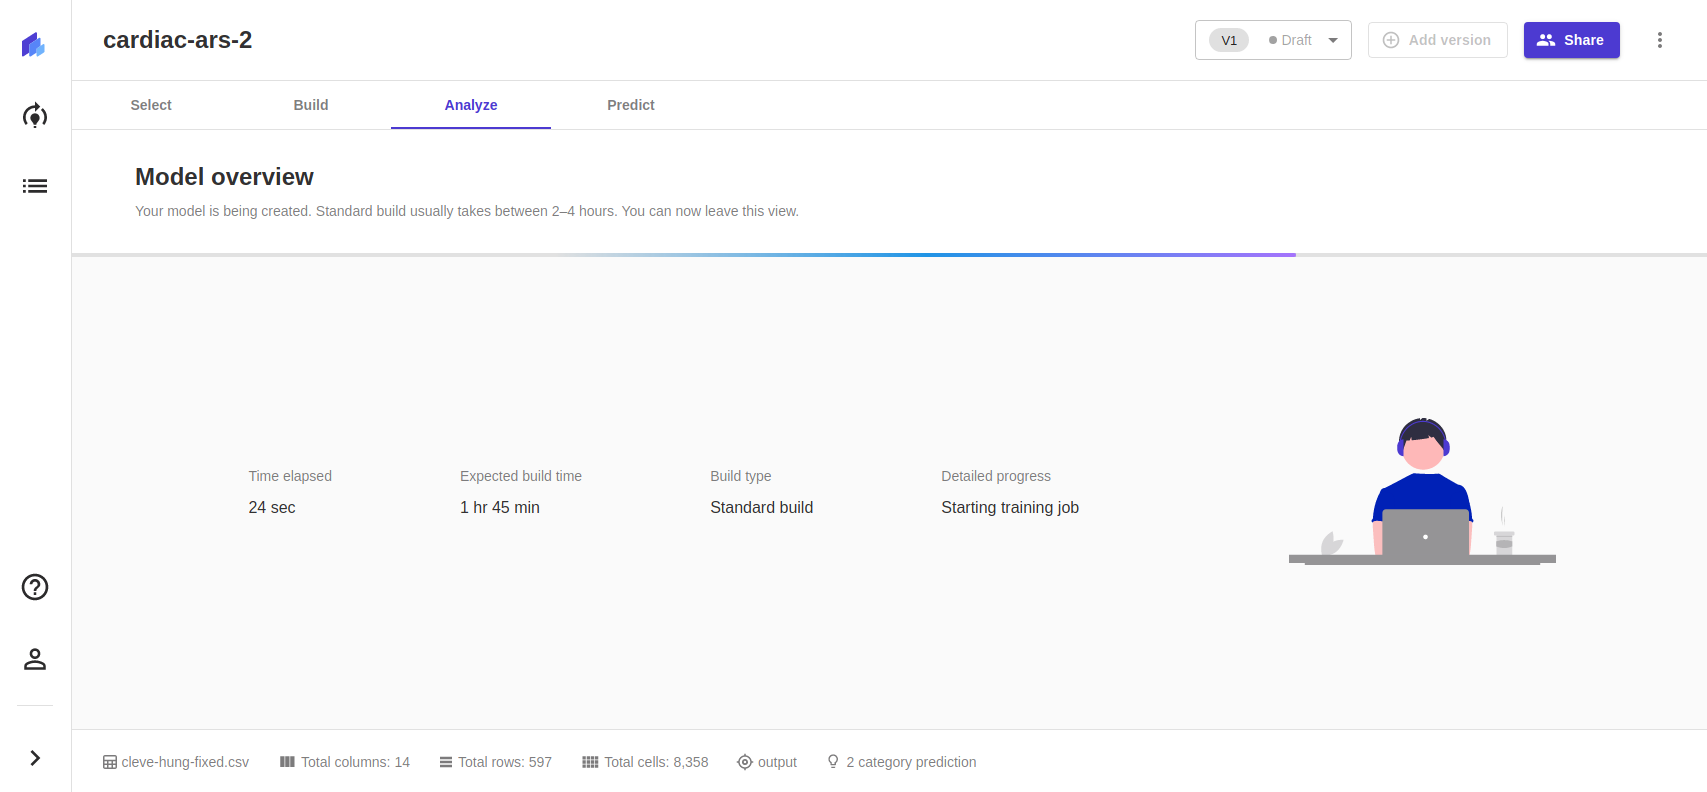
In the middle of this task, the Canvas interface blew up, and we thought we had lost the job. In fact, our authentication token for the interface had expired, and we had to re-authenticate to see what happened. Of course, we were still burning AWS EC2 compute while disconnected. We managed to get re-attached to the Canvas domain we had set up and found the project was complete, with surprising results:
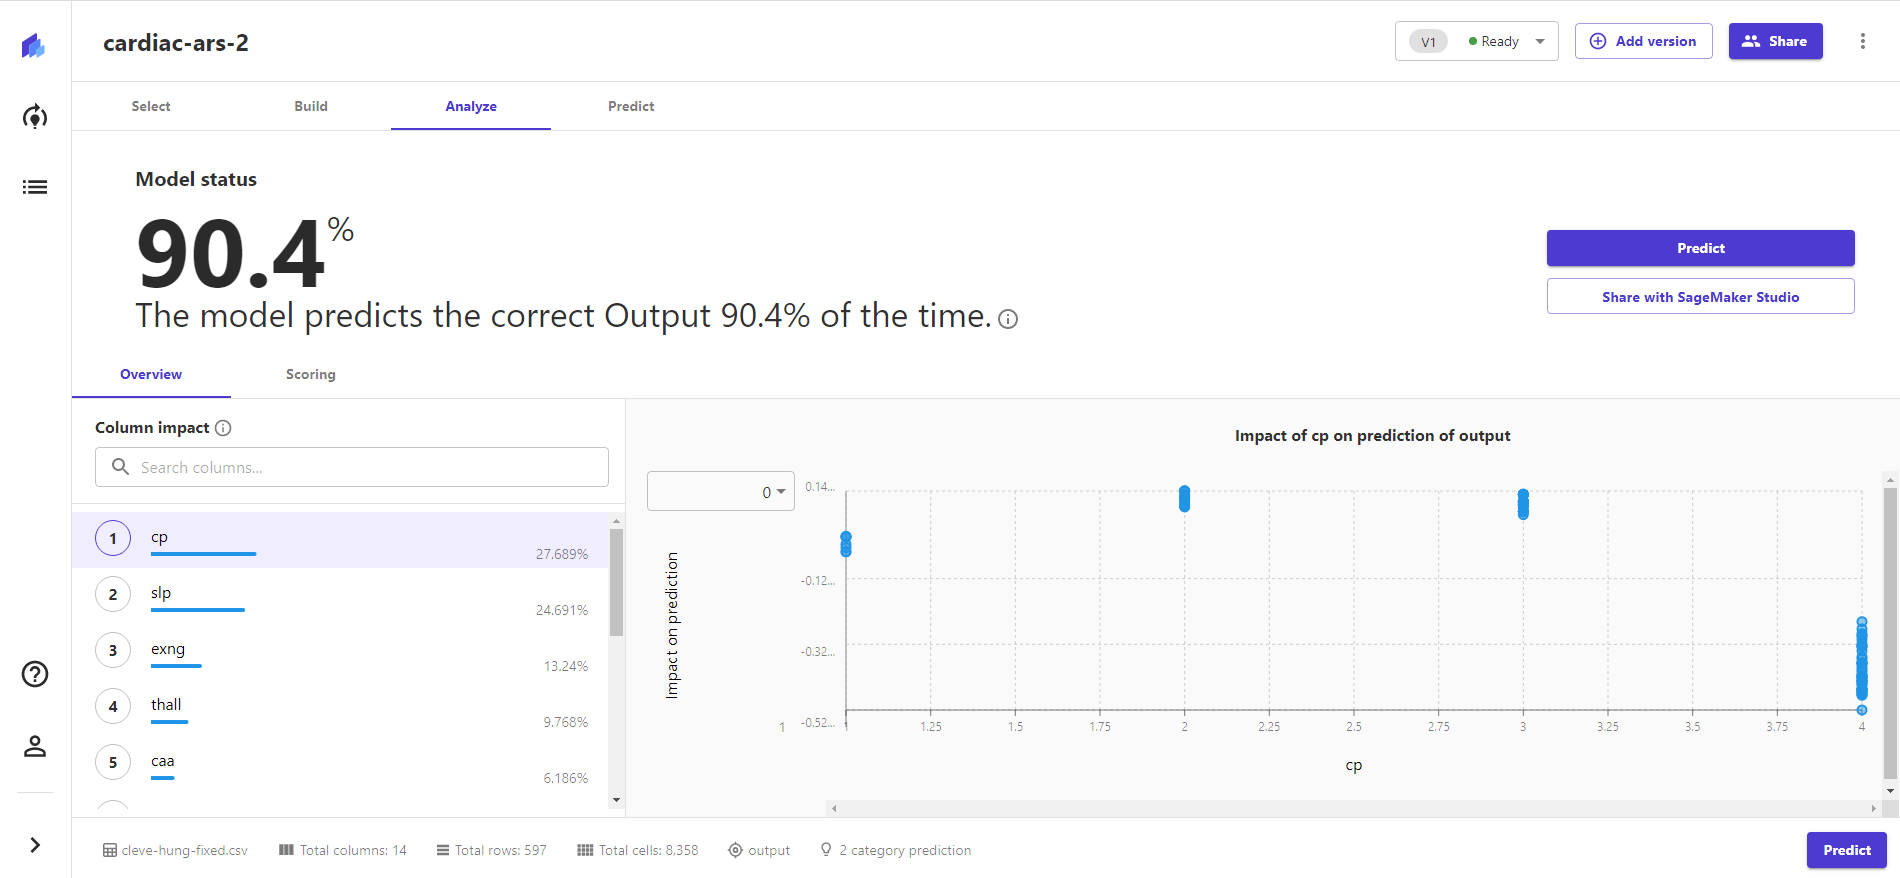
This time, we had better than 90 percent accuracy. With two of the highest impact data columns from the last test largely absent in the Hungarian data, the chest pain categorization became the top influencer, followed by the type of slope on electrocardiogram readouts during peak exercise ("slp").
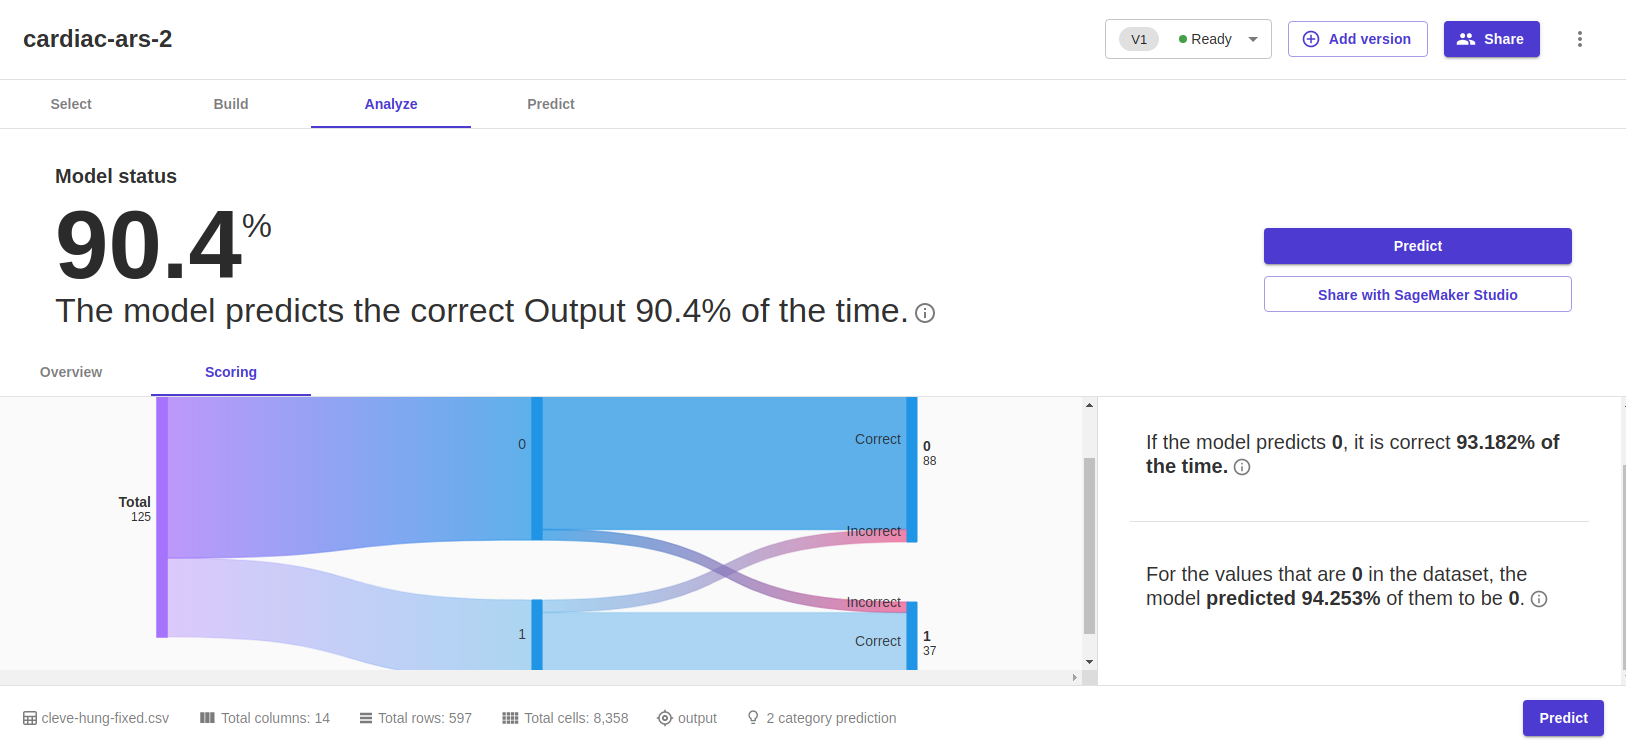
The test set was 125 rows this time—a more statistically supportable collection, to be sure. And the model created had a false positive rating of less than 6 percent.
To see if this analysis held up better to severe holes in the data, we ran the Swiss records through the batch prediction feature. The results were as we expected—with no prediction with a level of certainty over 72 percent and the vast majority in the 50 to 60 percent range, the model predicted accurately 68 percent of the time. For rows with thalassemia or angiogram data present (and none of them had both), the accuracy went up to 71 percent—not great, but not terrible.
Looking under the hood
Canvas is intended to provide a way for business analysts to collaborate with data scientists, so we were able to export the model created for this test and its data set as a SageMaker Studio link and get a deeper look at the model that was created. Suddenly, we were back in the Jupyter Notebook-based Studio environment in which we had spent last summer grinding on headline data.
Jumping into the model details, we got a look behind the curtain at what AutoML had done at Canvas' behest.
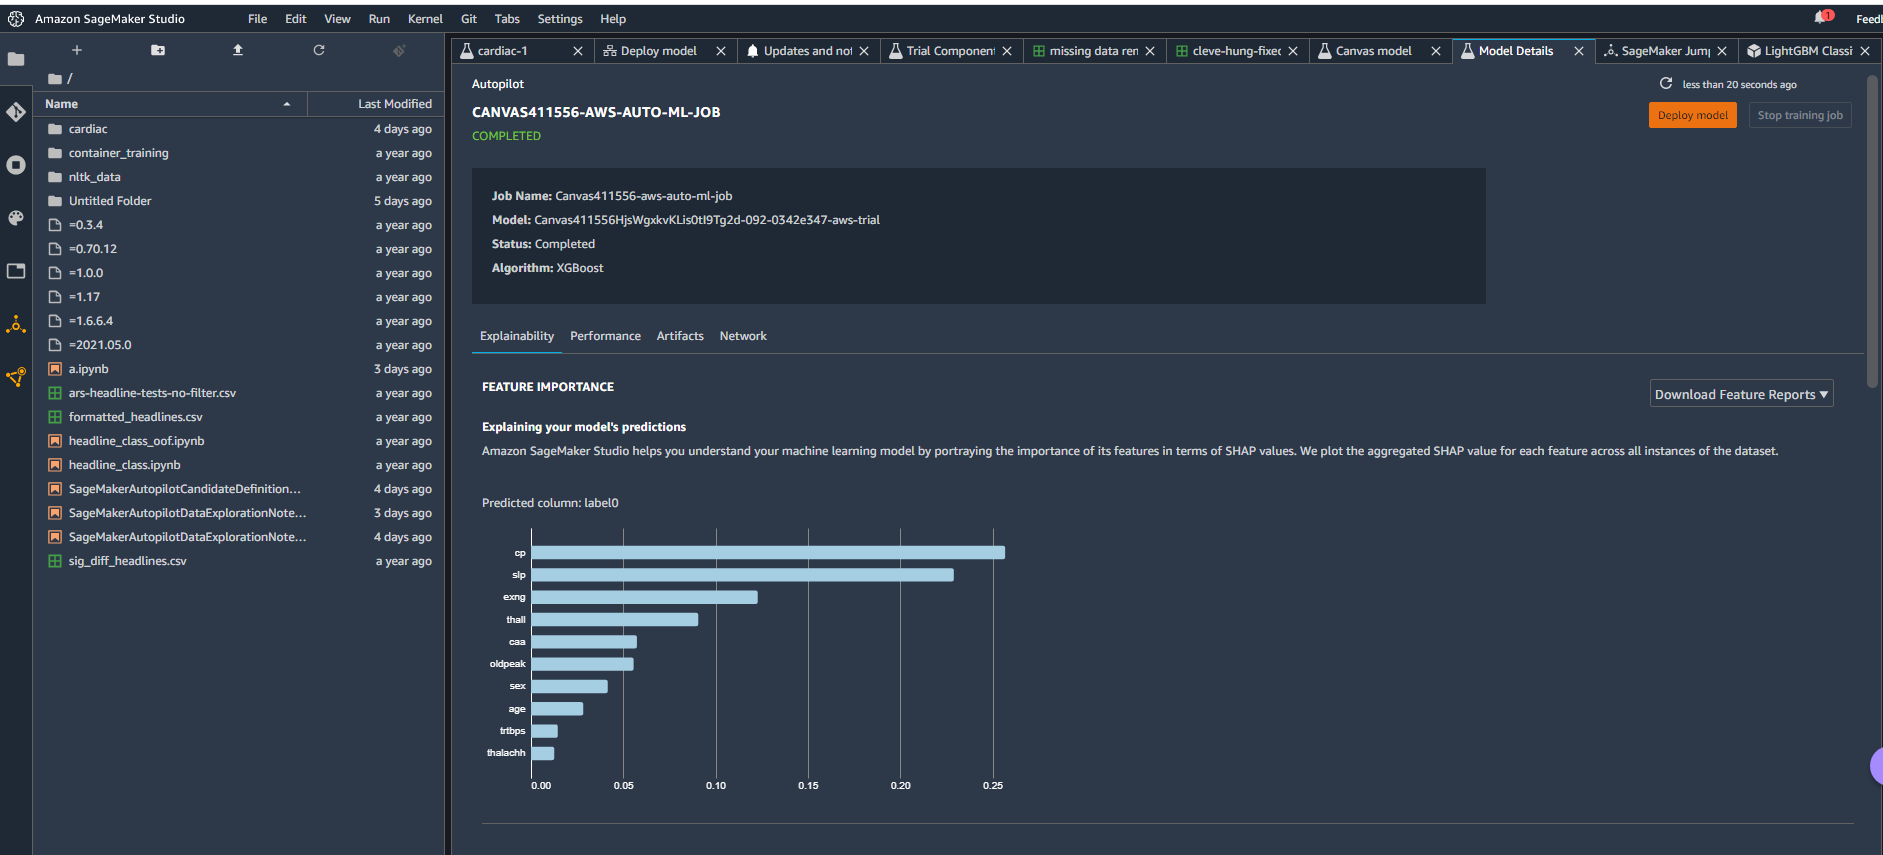 Model details.
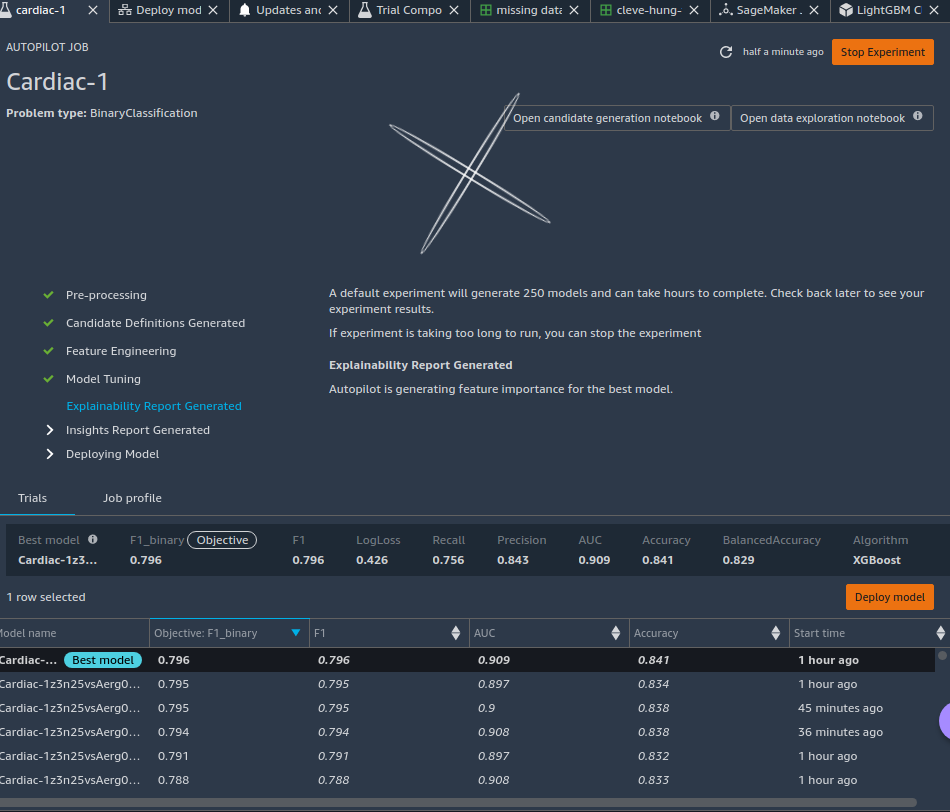 Extreme gradient boosting!
The winning model selected was based on XGBoost. That makes sense because XGBoost (which stands for eXtreme Gradient Boosting) is one of the better current algorithm sets for doing this sort of classification project.
("The design assumption," added Amazon's Danny Smith, "was if you're going to help the data science team, let's not have them review half-baked models. Let's have them review something more polished... What we've found so far is that business analysts don't tend to care what the algorithms are. They want to know if they can trust the answer and if it gives them some insights to making better decisions.")
In our next installment, we'll dig into some of these details and attempt to squeeze out a bit more model accuracy using SageMaker's Data Wrangler and the AutoML feature within Studio. Maybe a little data manipulation will help XGBoost get us north of 91 percent accuracy—as long as we don't overtrain in vain.
Setting our heart-attack-predicting AI loose with “no-code” tools - Ars Technica
Read More


No comments:
Post a Comment